Cookie information

Cookies are small files installed on your computer or smartphone. They allow us to store information about your navigation on our site.

Choose cookies Accept all cookies

Privacy Policy

Accept all cookies close

Cookie information

Olea Medical uses three types of cookies:

  • Session or preference cookies, which are essential for navigation and the good functioning of the site
  • Audience measurement cookies and other tracers used to establish site audience statistics

These cookies are configured according to the criteria for exemption from consent as defined by the CNIL

CookieTypeDescription
Service supplyStores consent for each "tracker" type cookie.
Service supplyStores authentication related to case report downloads
User authenticationCustomer area only. This cookie will not be set if you do not log in to your account.
Service supplyStores the current language
TrackingGoogle analytics

Enhancing brain tumor characterization with pCASL imaging

Lucia NICHELLI, MD, PhD Candidate, Neuroradiologist, Pitié-Salpêtrière Hospital – Paris- France

Mehdi BENSEMAIN, MD, Neuroradiologist, Pitié-Salpêtrière Hospital – Paris- France

Medical history

A 55 year-old woman underwent an MRI after 2 months of a sensory-motor deficit of the right hemibody. Symptoms were progressive, predominant on the lower limb, and required a walking aid. Partial motor seizures also occurred, with spontaneous resolution within a few minutes.

Image acquisition and analysis

MR images were obtained using a 3T MRI scanner (Skyra, Siemens Healthineers, Erlangen, Germany). The protocol included 3D T2-weighted (T2w), Fluid-Attenuated Inversion Recovery (FLAIR) and T1-weighted acquisitions before (T1w) and after (T1wE) contrast injection, as well as Diffusion Weighted Imaging (DWI), Susceptibility Weighted Imaging (SWI), Dynamic Susceptibility Contrast (DSC) perfusion and Pseudo-Continuous Arterial Spin Labeling (pCASL) sequences.

DWI, DSC perfusion and pCASL data were post-processed with Olea Sphere 3.0 (Olea Medical, La Ciotat, France) to obtain Apparent Diffusion Coefficient (ADC), DSC relative Cerebral Blood Volume (rCBV) and pCASL relative Perfusion Weighted Imaging (rPWI) maps, respectively.

Findings

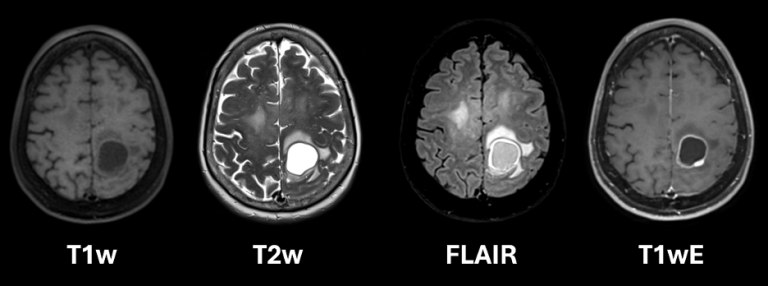
Conventional MRI sequences revealed a contrast-enhancing, necrotic, peri-rolandic left mass (Fig. 1).

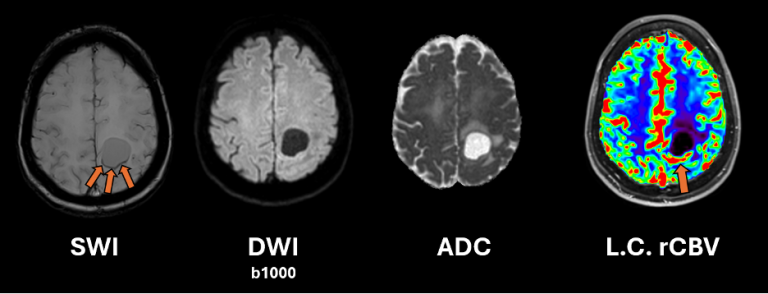
SWI showed a high intra-tumoral susceptibility signal (ITSS) in the posterior and mesial side of the lesion (orange arrows), possibly partially influencing DWI signal and rCBV cartography derived from DSC perfusion (Fig. 2).

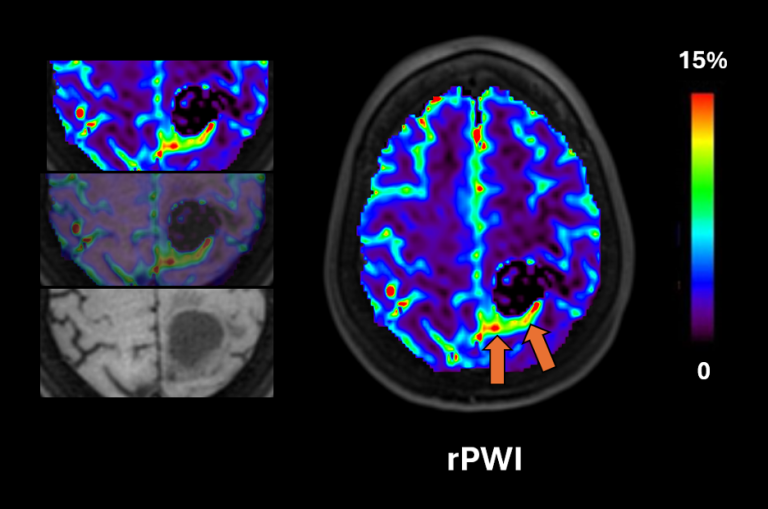
The 3D pCASL rPWI map was also markedly increased in this part of the lesion (Fig. 3).

pCASL imaging definitely confirmed the presence of neo-angiogenesis in the peri-rolandic left mass. Therefore, multimodal MRI suggested the presence of an aggressive brain tumor. Subsequent partial surgical resection and histo-molecular analysis allowed the diagnosis of glioblastoma, IDH-wildtype, WHO grade 4.

Conclusion

This case illustrates the benefit of adding pCASL perfusion in brain tumor characterization. While sus­ceptibility artefacts are commonly present in pre- and post-surgical brain lesions and often affect DSC perfusion interpretation, they do not impact pCASL analysis, hence increasing the clinical value of this contrast-free perfusion technique.

Figure 1

Figure 1 Conventional MRI sequences

Figure 2

Figure 2 Additional MRI sequences: SWI, DWI (acquired at b=1000), ADC and rCBV after leakage correction (L.C.)

Figure 3

Figure 3 A rPWI map was generated from pCASL data. Seven pairs of label and control volumes were collected using a 3D turbo gradient spin echo technique with a single inversion time of 2 seconds. The data underwent denoising, motion correction, averaging and deblurring processes. The rPWI values were calculated using the formula: rPWI (%) = 100 × (Control – Label) / Control. Neo-angiogenesis was identified by the rPWI map (orange arrows)